IDAP'26 · 10th International Artificial Intelligence and Data Processing Symposium · IEEE
Impact of Input Resolution on Lightweight Small Ship Detection in SAR Imagery
Summary
At a Glance
Most SAR ship detection papers design a new network. This study keeps a lightweight network fixed and asks a simpler question: how much does the input image size alone change the result?
15 YOLO variants compared on HRSID at 800 px to find compact, strong baselines.
YOLOv8n trained and tested at six input sizes: 640, 800, 1024, 1280, 1344 and 1600 px.
Resolution is a simple, strong lever: accuracy and especially localization improve without a larger model.
1 · Motivation
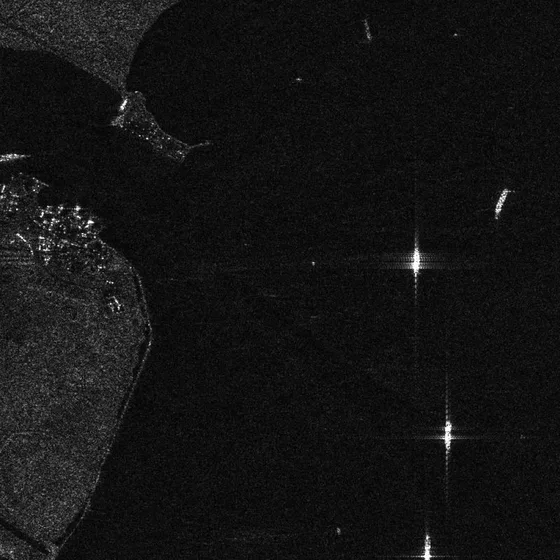
Why SAR Ship Detection Is Hard
Synthetic aperture radar images the sea day and night, in any weather, at high resolution. That makes it valuable for traffic management, navigational safety and coastal surveillance.
The same imaging physics makes detection difficult:
- Speckle noise and sea clutter look like small bright targets.
- Inshore scenes: harbours, canals and man-made structures scatter strongly.
- Dense targets and severe foreground–background imbalance.
- Small ships cover only a handful of pixels.
1 · Motivation
Research Gap and Contribution
Attention, enhanced feature extraction, multiscale receptive fields, improved regression losses.
Super-resolution, space-to-depth, deformable convolution, dedicated small-object heads, NWD loss.
HRLE-SARDet, GS-YOLO, EMO-YOLO, LWSARDet, SADW-Det: fewer parameters for real-time use.
2 · Materials and Methods
HRSID: High-Resolution SAR Images Dataset
- 136 panoramic SAR scenes: 99 Sentinel-1B, 36 TerraSAR-X, 1 TanDEM-X
- Various imaging modes and polarizations; spatial resolution 0.5–3 m
- Cropped to 800 × 800 px patches
- 5,604 images, 16,951 annotated ships
- Large patches keep context: sea clutter, harbours, canals, structures
- Split 7 : 2 : 1 into train / validation / test
Ship sizes (MS COCO scale definition)
2 · Materials and Methods
Why Resolution Matters: the Pixel Budget
The square is a 64 × 64 px window of an 800 px HRSID patch. Blue lines are feature-map cells. Raising the input size keeps the ship fixed but makes the cells finer, so the small ship meets the receptive field of the detection layers.
2 · Materials and Methods
Two-Stage Experimental Design
7 : 2 : 1 split
input 800 px
compact, strong baseline
640 → 1600 px
Held constant
- Architecture and parameter count (3.2 M)
- Dataset split, training strategy, metrics
- Bilinear resizing (Ultralytics default)
Varied
- Input size: 640, 800, 1024, 1280, 1344, 1600 px
- So any change in P, R, mAP or cost is attributable to resolution
Metrics: precision (P), recall (R), mAP50 (IoU 0.5), mAP50:95 (IoU 0.5 to 0.95, a stricter localization test), parameters, FLOPs, inference time, FPS, peak GPU memory.
3 · Experiments
Experimental Setup
| Training | |
|---|---|
| Epochs | 100 |
| Batch size | 16 |
| Optimizer | AdamW (auto) |
| Initial learning rate | 0.002 |
| Momentum | 0.9 |
| Weight decay | 0.0005 |
| Split | 70 / 20 / 10% |
| Platform | |
|---|---|
| CPU | Intel Core i5-12450H |
| Memory | 16 GB |
| GPU | RTX 3050 Laptop, 6 GB |
| OS | Windows 11 |
| Python / PyTorch | 3.13.2 / 2.8.0 |
| CUDA / cuDNN | 12.9 / 9.1 |
| Ultralytics | 8.4.37 |
A laptop-class GPU on purpose: the cost figures describe what a resource-constrained deployment would see.
3 · Experiments · Table I
Stage 1: Comparing 15 YOLO Models (800 px)
3 · Experiments · Table I
Table I in Full (click a header to sort)
| Model | P | R | mAP50 | mAP50:95 | Params (M) |
|---|---|---|---|---|---|
| YOLOv8s | 92.5 | 86.2 | 93.7 | 62.1 | 8.1 |
| YOLO11s | 92.1 | 83.9 | 93.5 | 61.8 | 25.8 |
| YOLOv5s | 88.2 | 81.2 | 93.5 | 67.5 | 26.8 |
| YOLO26s | 92.0 | 84.1 | 93.0 | 68.5 | 9.5 |
| YOLOv5n | 91.7 | 84.0 | 92.8 | 68.3 | 2.5 |
| YOLOv9-tiny | 93.3 | 85.6 | 92.8 | 69.6 | 2.0 |
| YOLO11n | 91.3 | 84.3 | 92.6 | 68.4 | 2.6 |
| YOLOv8n | 91.9 | 84.2 | 92.6 | 67.5 | 3.2 |
| YOLO10n | 93.5 | 85.4 | 92.6 | 71.1 | 2.3 |
| YOLO26n | 89.8 | 82.4 | 91.8 | 67.4 | 2.4 |
| YOLO12n | 91.4 | 81.4 | 91.5 | 66.0 | 2.6 |
| YOLOv6 | 92.5 | 81.9 | 91.2 | 66.2 | 4.7 |
| YOLOv4 | 90.6 | 84.0 | 90.1 | 65.1 | 64.3 |
| YOLOv3-tiny | 87.9 | 79.1 | 86.5 | 59.8 | 12.1 |
| YOLOv7-tiny | 90.7 | 82.4 | 81.9 | 54.7 | 6.2 |
HRSID test set, 800 px input, values in %. Rows are initially ranked by mAP50 as in the paper.
4 · Results · Table II
Stage 2: Effect of Input Resolution on YOLOv8n
640 → 1024 px adds +3.4 pp; 1280 → 1600 px adds only +0.2 pp.
mAP50:95 still rises from 72.0% to 74.6% between 1280 and 1600 px: resolution helps box precision most.
4 · Results · Table III
The Price of Resolution
250 randomly selected test images, fixed batch size. From 640 to 1600 px: latency 4.71 → 25.54 ms, throughput 212.30 → 39.15 FPS, peak GPU memory 211 → 805 MB.
4 · Results · Tables II + III
Choose an Operating Point
Set the throughput your application needs. The explorer picks the input size with the highest mAP50:95 that still meets it, using the paper's measurements on the RTX 3050 Laptop GPU.
1600 px: best mAP50 and mAP50:95.
1024 or 1280 px: a better accuracy / real-time balance.
4 · Results · Table IV
Comparison with the State of the Art (HRSID)
| Method | P | R | mAP50 | mAP50:95 | Params (M) | FLOPs (G) |
|---|---|---|---|---|---|---|
| YOLOv8n-1600px | 91.6 | 87.9 | 94.8 | 74.6 | 3.2 | 51.2 |
| YOLOv8n-1280px | 91.3 | 87.1 | 94.6 | 72.0 | 3.2 | 32.7 |
| LD-YOLO | 93.5 | 87.6 | 94.6 | 72.0 | 4.5 | 12.0 |
| Zhou et al. | 92.3 | 88.9 | 94.5 | 63.1 | 45.6 | 19.4 |
| GS-YOLO | 92.7 | 89.5 | 94.3 | 71.0 | 24.6 | 12.8 |
| LWSARDet-Small | 92.5 | 89.3 | 94.2 | 66.9 | 6.45 | 12.8 |
| LWSARDet-Nano | 92.0 | 87.9 | 94.1 | 67.0 | 1.63 | 3.4 |
| EMO-YOLO | 92.8 | 87.6 | 94.1 | – | 2.0 | – |
| DGSP-YOLO | 93.0 | 86.9 | 94.0 | 72.2 | – | – |
| FESAR | 93.5 | 85.8 | 94.0 | – | 3.5 | 46.8 |
| LiteSAR-Net | – | 90.9 | 93.3 | – | 5.25 | – |
| SIE-YOLO11 | – | – | 92.9 | 70.1 | – | – |
| MSFA-YOLO | 92.4 | – | 92.7 | 67.1 | – | – |
| HRLE-SARDet | – | 86.0 | 92.5 | – | 1.09 | 2.5 |
| SADW-Det | – | – | 92.1 | – | 5.53 | 28.38 |
| GL-DETR | 91.4 | – | 92.1 | – | – | – |
| SDNet | – | 87.5 | 91.1 | – | 12.1 | 12.5 |
| YOLO-LDFI | 91.9 | – | 90.7 | 64.4 | 2.63 | 6.7 |
| DRENet | – | 82.6 | 90.0 | – | 12.0 | 13.1 |
| DBW-YOLO | 90.0 | – | 88.8 | – | – | – |
| SAR-Net | 53.7 | 80.5 | 87.5 | – | 42.6 | 104.2 |
Reported values with different splits, input sizes and epochs: a reference, not an identical protocol. 1600 px gives the highest mAP50 and mAP50:95 at higher FLOPs.
4 · Results · Figs. 1–2
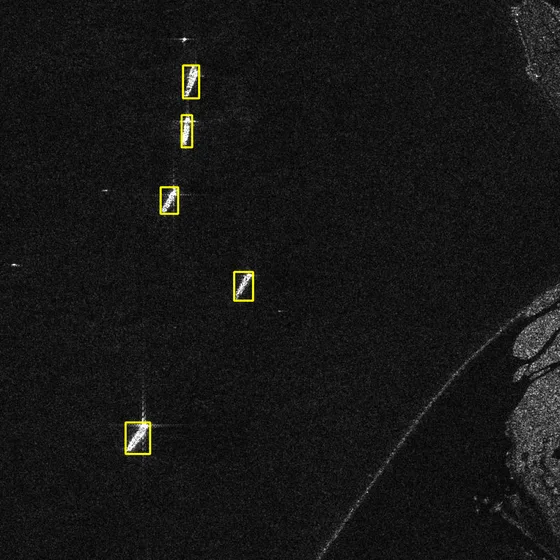
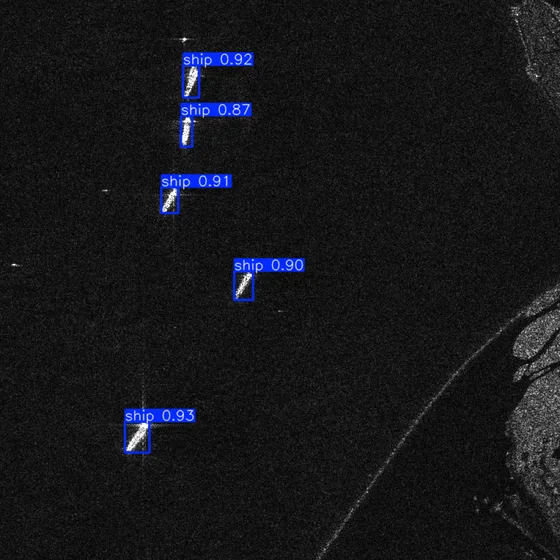
Qualitative Results: See the Difference
5 · Discussion
What the Results Say
Without any architectural change, YOLOv8n gains +4.3 pp mAP50 and +8.0 pp mAP50:95 from 640 to 1600 px.
mAP50 saturates near 1280 px; mAP50:95 keeps rising. Small ships get tighter boxes.
Missed small ships and extra boxes on bright scatterers appear more often at lower input sizes.
Same 3.2 M parameters, but 5.4× latency and 3.8× peak memory at 1600 px. Budget the input size, not only the model.
6 · Conclusion
Conclusion and Future Work
- Compact YOLO models are competitive on HRSID with low model complexity.
- Increasing the input size significantly improves detection and localization of small ships.
- YOLOv8n-1600 px: 91.6% P, 87.9% R, 94.8% mAP50, 74.6% mAP50:95 with 3.2 M parameters, the highest mAP values among the compared methods.
- Choose by application: 1600 px for accuracy, 1024–1280 px for real-time balance.
Next steps
- Lightweight feature enhancement, attention and resolution-preserving preprocessing
- Deployment tests on embedded and edge devices, detailed FLOPs analysis
- Additional SAR ship datasets to check generalization
6 · Conclusion
Check Questions
- Why does a larger input size help small ships more than large ships?
- mAP50 barely changes from 1280 to 1600 px, but mAP50:95 rises by 2.6 pp. What does that tell you?
- The parameter count is constant across all six configurations. Why does inference still get 5× slower?
- Why should Table IV not be read as a strict head-to-head ranking?
- A shore-based system must process 60 frames per second on the same GPU. Which input size would you choose?
Show answers
- Small ships occupy few pixels; downsampling and large strides can shrink them below one feature cell. Upscaling gives them more pixels and better matches the receptive fields.
- Coarse detection (IoU 0.5) is already saturated; the extra pixels mainly make the boxes more precise at stricter IoU thresholds.
- Convolution cost and activation memory grow with the number of input pixels (FLOPs 32.7 G at 1280 px vs 51.2 G at 1600 px), independent of the weights.
- The methods use different splits, input sizes and training epochs; the table is a reference point, not an identical protocol.
- 1024 px (94.11 FPS) meets it; 1280 px (55.17 FPS) does not. 1024 px gives 93.9% mAP50 and 70.1% mAP50:95.
References
Selected References
- S. Wei et al., "HRSID: A High-Resolution SAR Images Dataset for Ship Detection and Instance Segmentation," IEEE Access, vol. 8, pp. 120234–120254, 2020.
- X. Xu et al., "Deep learning for ship detection in SAR images: A comprehensive review," Ocean Engineering, vol. 355, 125045, 2026.
- J. Niu et al., "LD-YOLO: A Lightweight Dynamic Convolution-Based YOLOv8n Framework for Robust Ship Detection in SAR Imagery," IEEE GRSL, vol. 23, 4000305, 2026.
- D. Lv et al., "GS-YOLO: A Lightweight SAR Ship Detection Model Based on Enhanced GhostNetV2 and SE Attention Mechanism," IEEE Access, vol. 12, 2024.
- Y. Zhao et al., "LWSARDet: A Lightweight SAR Small Ship Target Detection Network Based on a Position–Morphology Matching Mechanism," Remote Sensing, vol. 17, 2514, 2025.
- Z. Wang et al., "The evolution of object detection from CNNs to transformers and multi-modal fusion," Scientific Reports, vol. 16, 7517, 2026.
The paper lists 28 references; see the full text for the complete list.