Research Article · IEEE Access · Vol. 14 · 2026
Enhancing Radar PPI-Based Maritime Object Detection Using Hybrid Preprocessing and Deep Learning Approach
Summary
At a Glance
Off-the-shelf detectors miss small, low-contrast buoys in radar PPI images. This study combines radar-specific preprocessing with two small-object changes to YOLO, then checks whether the gains survive on real radar.
HSV segmentation, adaptive binarization and morphological closing clean the radar frame.
A high-resolution P2 head and an area-aware loss for boxes under 8 × 8 px.
Five YOLO models on simulator data, then external tests on real Baltic Sea radar.
1 · Introduction
Why Radar PPI Images Are Hard for Detectors
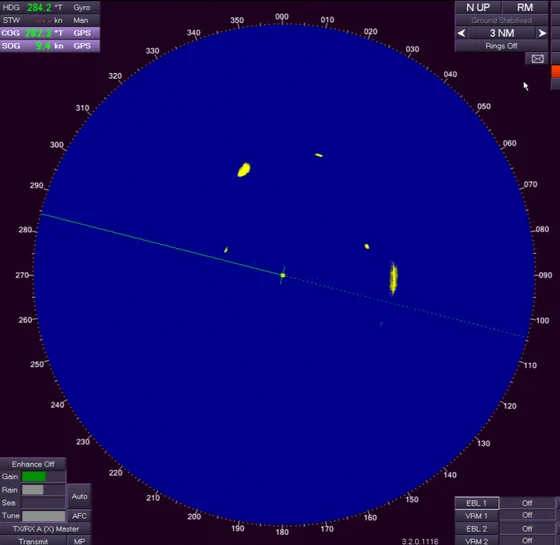
The Plan Position Indicator shows radar returns as a 2-D polar map around the own ship: the cornerstone of radar navigation in fog, at night and in heavy traffic.
- Not a photograph: grey-level intensity instead of colour and edges, diffuse boundaries.
- Clutter that looks like targets: sea clutter, speckle noise, low SNR, multipath.
- Small, weak targets: buoys cover a few pixels and are easily missed or loosely boxed.
- The gap: classic fixes (thresholding, morphology) are rarely built into end-to-end deep pipelines, and new YOLO variants are rarely tested on radar PPI.
1 · Introduction
Four Contributions
Added to selected YOLO models to keep fine spatial detail for small, low-contrast objects.
Box losses of objects smaller than 8 × 8 px are weighted up, so safety-critical buoys are not under-learned.
YOLOv5s, v8s, v10s, v11s and v12s on the same 350-frame simulated dataset, raw and preprocessed.
External tests on the DAAN marine radar dataset, with an analysis of simulated-to-real transfer.
Unlike studies that address one component (clutter suppression, lightweight detection, segmentation or tracking), this work integrates preprocessing, model evaluation, P2, loss design, light backbones and real-data validation in one pipeline (Table 1).
2 · Methodology · Table 2
A 350-Frame Simulated Radar Dataset
- Generated with the Wärtsilä NTPro 5000® bridge simulator.
- Screenshots at set intervals from a ~2-hour recording, not consecutive video frames, so scenes are diverse.
- Captured at 1280 × 1280, resized to 640 × 640.
- Three classes: fixed (buoys), target (moving vessels), landmass (coastline).
- Auto-labelled, then manually cross-validated.
- Split 70 / 20 / 10%: 5,204 / 1,730 / 913 instances.
2 · Methodology · Algorithm 1
A Four-Step Preprocessing Pipeline
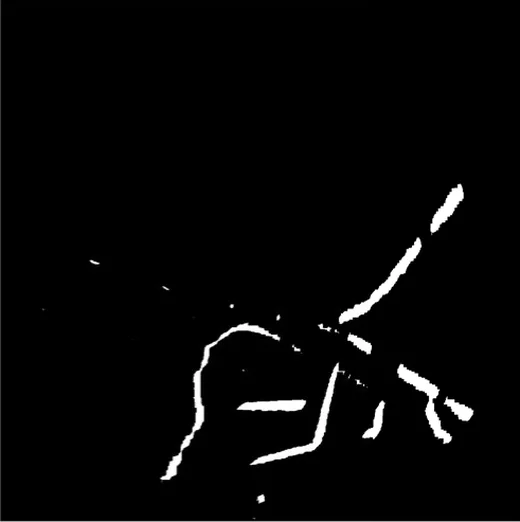
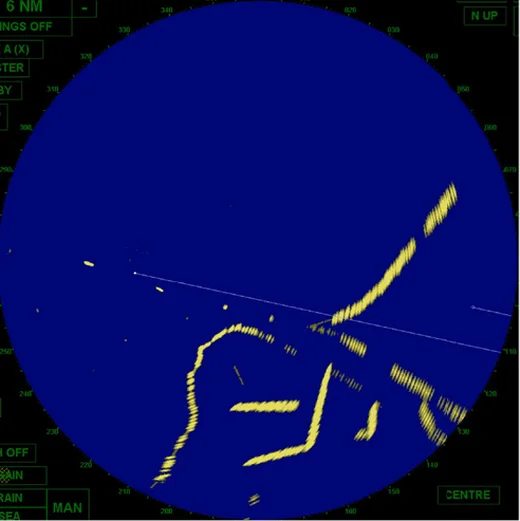
processedrawDrag the divider to compare the raw frame and the result (Fig. 3).
The HSV thresholds are stable because commercial radar displays use fixed colour lookup tables: strong echoes always fall in a narrow yellow band.
The result keeps high-intensity echoes, joins their fragments and removes the disc, range rings and interface text.
2 · Methodology · Interactive
Preprocessing Lab: Run the Pipeline Yourself
Runs in your browser on the Fig. 3 frame. The hue range and threshold offset are chosen for this demo; the paper's exact thresholds were set empirically and are not listed.
2 · Methodology · Fig. 2
Choosing the Closing Kernel
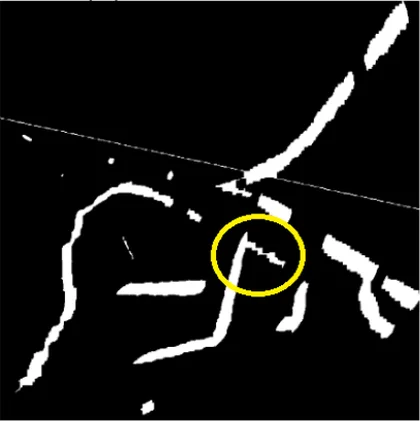
< 7 × 7
- gaps remain
- split detections
> 11 × 11
- over-smoothing
- separate echoes merge
11 × 11 is dataset-specific: echo thickness, display scale and clutter differ between radars, so it should be re-tuned for other systems.
2 · Methodology · Algorithm 2
From Contours to YOLO Labels
External contours of the processed frame are boxed; the box area A = w × h decides the initial class.
A < Tfixed: small, stationary echoes
Tfixed ≤ A < Ttarget: moderate, moving echoes
A ≥ Ttarget: large, stable regions
2 · Methodology
Five YOLO Generations
| Model | Key idea | Expected effect on radar |
|---|---|---|
| YOLOv5s | CSPDarknet53 + PANet, anchor-based head | solid baseline; fixed anchors fit variable echo shapes poorly |
| YOLOv8s | anchor-free, decoupled heads | better localization of scattered, low-contrast targets |
| YOLOv10s | ELAN backbone, efficient anchor-free design | aimed at resource-constrained, real-time use |
| YOLOv11s | refined v8 backbone / neck, SPPF, better training | robust features and generalization |
| YOLOv12s | attention-centric: R-ELAN, Area Attention (A2C2f) | larger effective receptive field, focus on informative regions |
Box loss uses Complete IoU; every model was trained with the same hyperparameters.
2 · Methodology · Fig. 4, Eqs. (8)–(10)
Seeing Smaller: the P2 Feature Layer
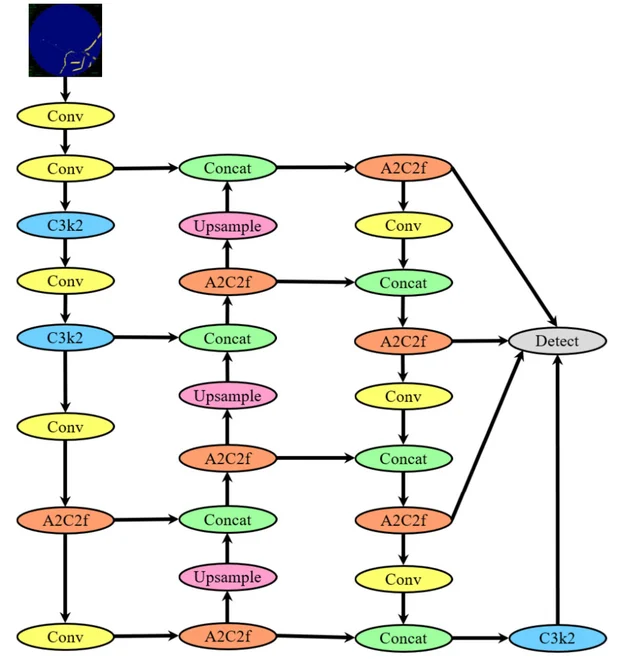
The head now predicts at P2/4, P3/8, P4/16 and P5/32. At 640 px input, P2 is a 160 × 160 map: an 8 × 8 px buoy spans 2 × 2 cells instead of a quarter of a P5 cell.
2 · Methodology · Eqs. (11)–(12)
Teaching the Model to Care About Small Objects
Dashed square: the 8 × 8 threshold, about the median buoy size. Loss share is a toy estimate: training instances from Table 2, half of the buoy boxes taken as small, equal per-box loss.
3 · Results
Training Configuration and Metrics
| Framework | Ultralytics 8.3.170, PyTorch 2.9 |
|---|---|
| Training GPU | RTX 5070 (12 GB) |
| Input / batch | 640 px / 16 |
| Epochs | 250 (mosaic off for last 10) |
| Optimizer | AdamW, lr 0.001429, momentum 0.9 |
| Loss gains | box 7.5 (CIoU), cls 0.5, dfl 1.5 |
| Augmentation | flip 0.5, scale 0.5, translate 0.1, HSV h/s/v 0.015/0.7/0.4 |
mAP50: mean AP over the three classes at IoU 0.5.
mAP50-95: also averaged over IoU 0.50, 0.55 … 0.95, a stricter localization test.
Latency was measured separately on a laptop RTX 3050 (6 GB), 640 × 640 input.
3 · Results · Tables 3–5
Results Explorer
3 · Results · Tables 3–5
Where the Gains Come From: the Fixed Class
The largest single step: YOLOv12s buoy mAP50-95 0.321 → 0.503.
Finer features: 0.503 → 0.595.
Mainly recall: YOLOv8s buoy recall 0.843 → 0.936.
3 · Results · Fig. 7
Detection Outputs: Raw vs Preprocessed
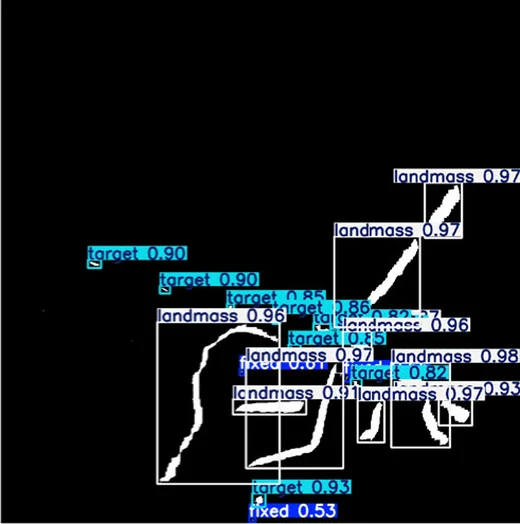
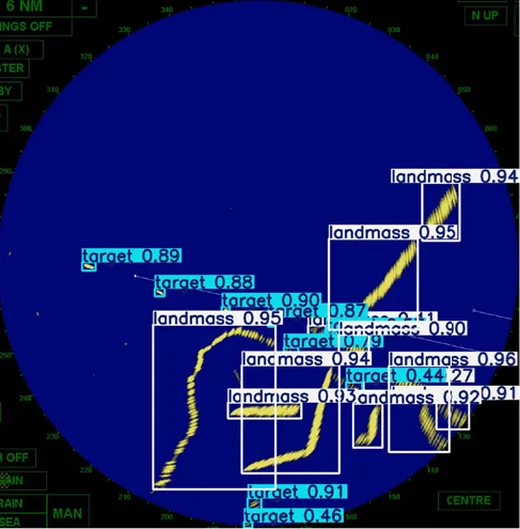
preprocessedrawPredicted boxes with confidence scores on the same scene.
- On the raw frame, boxes overlap heavily around the coastline and small echoes compete with clutter.
- On the preprocessed frame the echoes are isolated, so landmass, target and fixed objects are separated more cleanly.
3 · Results · Tables 6–7
Inference Latency
Standard models run faster than P2 variants, the expected cost of an extra detection scale. The area-aware loss changes training, not the inference graph, so its effect on latency is small.
3 · Results · Table 8
Model Complexity (click a header to sort)
| Model | Configuration | Layers | Params (M) | GFLOPs |
|---|---|---|---|---|
| YOLOv5s | Standard | 153 | 9.12 | 24.0 |
| YOLOv8s | Standard | 129 | 11.14 | 28.7 |
| YOLOv10s | Standard | 234 | 8.07 | 24.8 |
| YOLOv11s | Standard | 181 | 9.43 | 21.6 |
| YOLOv12s | Standard | 272 | 9.25 | 21.5 |
| YOLOv5s | Optimized | 84 | 9.11 | 23.8 |
| YOLOv8s | Optimized | 72 | 11.13 | 28.4 |
| YOLOv10s | Optimized | 106 | 7.22 | 21.4 |
| YOLOv11s | Optimized | 100 | 9.41 | 21.3 |
| YOLOv12s | Optimized | 159 | 9.23 | 21.2 |
| YOLOv8s + P2 | Standard | 160 | 10.64 | 37.0 |
| YOLOv12s + P2 | Standard | 327 | 9.38 | 28.3 |
| YOLOv8s + P2 | Optimized | 90 | 10.63 | 36.6 |
| YOLOv12s + P2 | Optimized | 189 | 9.36 | 27.8 |
"Optimized" = inference-time graph simplifications such as layer fusion. P2 barely changes the parameter count but raises GFLOPs (YOLOv8s 28.7 → 37.0): high-resolution maps are expensive to process.
3 · Results · Table 9
Lightweight Backbones: Accuracy vs Cost
Best accuracy: YOLOv12s mAP50 0.917, YOLOv8s mAP50-95 0.762.
Fastest and lightest: 1.8 GFLOPs, 9.1 ms, small accuracy cost.
Best balance: 0.751 mAP50-95 with 5.2 M params and 7.1 GFLOPs.
4 · Real-Data Validation · Figs. 9–10
The Real Test: DAAN Marine Radar Dataset
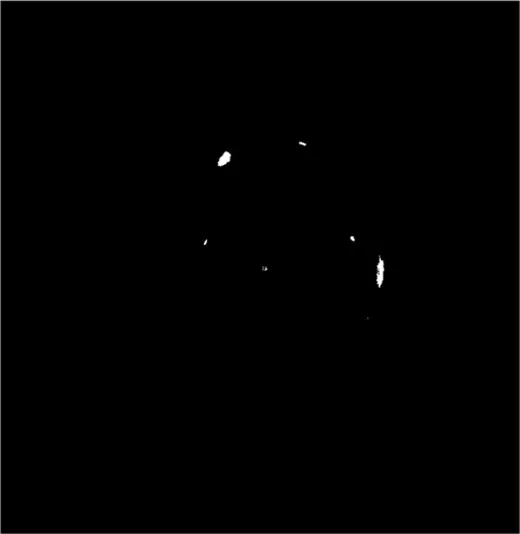
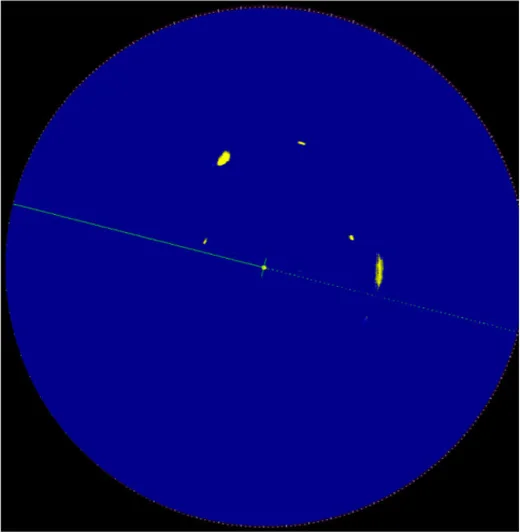
preprocessedcropped- Public DLR dataset recorded in the Baltic Sea: X-band radar screen captures at ~1 Hz from a moving own ship, with AIS reference tracks.
- Four vessels, own-ship motion, wake trails, varied encounter geometry.
- 3 NM range, no MTI or Doppler: clutter and echo distortion are preserved.
- AIS gives positions, not echo shapes, so labels come from a contour pipeline on the images with human checks.
- Never used in training: a true cross-domain test (platform, clutter, rendering).
4 · Real-Data Validation · Table 10
Do the Gains Transfer to Real Radar?
| Configuration | TP | FP | FN | mAP50 | mAP50-95 |
|---|---|---|---|---|---|
| Raw | 3301 | 41 | 1339 | 0.6983 | 0.6750 |
| Preprocessed | 4296 | 230 | 344 | 0.9149 | 0.7243 |
| Preprocessed + P2 | 4306 | 315 | 334 | 0.9169 | 0.7406 |
| Preprocessed + P2 + Loss | 4329 | 315 | 311 | 0.9218 | 0.7451 |
False alarms rise (41 → 315), but missed detections fall far more (1,339 → 311): a better trade-off for navigation safety.
4 · Real-Data Validation · Fig. 11
Predictions on a Real Frame
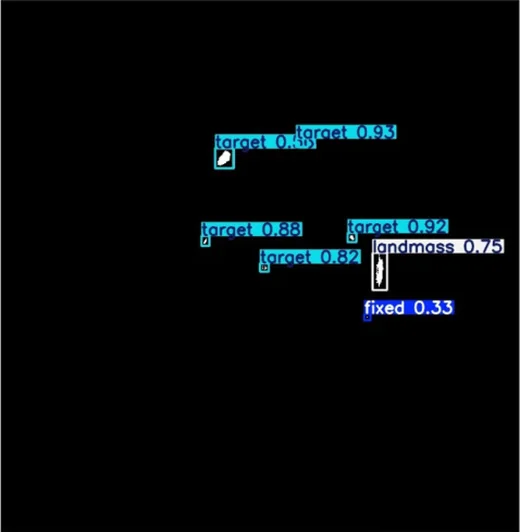
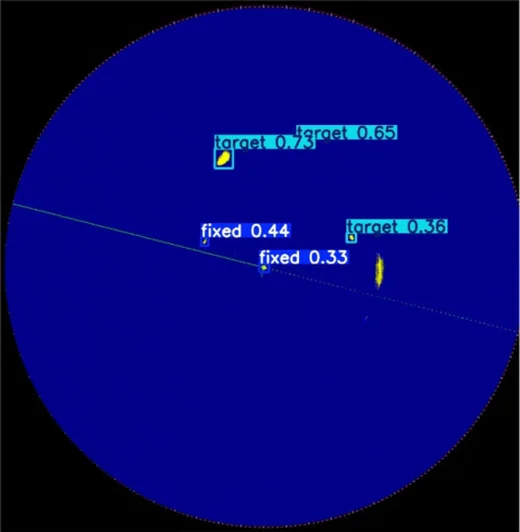
full modelraw modelRaw model: YOLOv12s trained on raw frames finds a few targets with low confidence (0.36–0.73).
Full model: YOLOv12s + P2 + area-aware loss on the preprocessed frame finds more targets with higher confidence (0.82–0.93).
5 · Discussion
Discussion and Limitations
Preprocessing makes buoys visible, P2 keeps them resolvable, the loss keeps them from being ignored. Larger classes do not suffer.
P2 variants are slower and need more GFLOPs; lightweight backbones such as GhostNet are a real-time alternative.
On DAAN the full configuration reduces misses and finds weak echoes, suggesting it learns radar structure, not simulator artefacts.
Simulated and display-captured images; one external domain; HSV thresholds and the 11 × 11 kernel depend on the display and radar.
6 · Conclusion
Conclusion and Future Work
- Radar-specific preprocessing lifts every YOLO model, most of all on small, low-contrast buoys.
- P2 + area-aware loss: YOLOv8s reaches 0.957 / 0.813 and YOLOv12s 0.958 / 0.812 (mAP50 / mAP50-95) on the simulated set.
- On real DAAN radar the full configuration reaches 0.922 mAP50 and 0.745 mAP50-95, up from 0.698 and 0.675.
- The approach supports reliable real-time situational awareness for autonomous maritime navigation.
Next steps
- Larger real-world radar datasets from multiple platforms
- Domain adaptation for cross-radar generalization
6 · Conclusion
Check Questions
- Why can a fixed HSV range isolate echoes reliably on commercial radar displays?
- What goes wrong with a closing kernel that is too small, and with one that is too large?
- An 8 × 8 px buoy at 640 px input: how many cells does it cover on P2 and on P5?
- Why does the area-aware loss mostly raise recall rather than precision?
- On DAAN, false positives rise from 41 to 315. Why is the full configuration still preferred?
Show answers
- The images are captured after display processing, which maps strong echoes to a fixed yellow through colour lookup tables.
- Too small leaves echoes fragmented (split detections); too large over-smooths and merges independent reflections.
- P2 (stride 4): 2 × 2 cells. P5 (stride 32): 0.25 × 0.25, a quarter of one cell.
- Small boxes get twice the weight, so weak buoy echoes are no longer ignored during training: fewer misses.
- Missed detections drop from 1,339 to 311; for navigation a missed vessel is more dangerous than an extra alarm.
References
Selected References
- J. S. Fowdur, M. Baum, F. Heymann, "Real-world marine radar datasets for evaluating target tracking methods," Sensors, vol. 21, no. 14, 4641, 2021.
- S. Külcü, "Radar image-based object detection and tracking for autonomous surface vehicles," Turkish J. Maritime Mar. Sci., vol. 12, no. 1, pp. 35–47, 2026.
- Y. Tian, Q. Ye, D. Doermann, "YOLOv12: Attention-centric real-time object detectors," 2025.
- A. S. Alamoush, A. I. Ölçer, "Maritime autonomous surface ships: Architecture for autonomous navigation systems," JMSE, vol. 13, no. 1, 122, 2025.
- Wärtsilä NTPro 5000 bridge simulator; DAAN marine radar dataset, German Aerospace Center (DLR).
The paper lists 46 references. Figures are reproduced from the article, published under a CC BY 4.0 licence.