Research Article · Balkan Journal of Electrical & Computer Engineering · Vol. 14 · 2026

Bias Mitigation in Ensemble-Based Meat Freshness Classification Using Grad-CAM

Sercan Külcü · Duygu Balpetek Külcü
Computer Engineering and Food Engineering Departments, Giresun University, Türkiye
Reliability paradoxMeat Freshness datasetBaseline biasMiniCAM TTAWeighted ensembleGrad-CAM afterState of the artCross-validation
doi: 10.17694/bajece.1817907 · Use ← → or Space to navigate, F for full screen

Summary

At a Glance

A freshness classifier can score 98.9% while looking at the packaging tray instead of the meat. This study uses Grad-CAM to expose that bias and a lightweight attention + ensemble design to remove it.

Test accuracy99.78%held-out test set
5-fold CV99.66%± 0.23, as reported
Model4.3 Mparameters · 16.5 MB
Speed825.1FPS on an RTX 3050 Laptop
Detect the bias

Grad-CAM shows a YOLO11s-cls baseline deciding from the tray.

Redirect attention

A MiniCAM module in MobileNetV2 focuses on colour, texture and moisture.

Fuse for robustness

MobileNetV2 + TTA, SVM and XGBoost on fused features, combined by tuned weights.

1 · Introduction

Accurate Is Not the Same as Reliable

Spoiled meat brings health risks and large economic losses. Sensory checks and lab tests are slow, costly and destructive, so they cannot support real-time inspection in markets and supply chains.

Computer vision is fast and non-destructive, and pre-trained CNNs report high accuracy. But what do they look at?

  • Recent works optimize accuracy and efficiency (VGG fusion, IAPO feature selection, compact CNN ensembles, MobileNetV3, Grad-CAM++ fusion).
  • Whether the learned features rely on meat cues or on spurious context such as trays is rarely analysed or corrected.
The reliability paradox. High accuracy does not guarantee that a model relies on semantically valid cues. In food safety, a model that is right for the wrong reason is a hidden risk when the setting changes.

1 · Introduction

Five Contributions

Grad-CAM-guided bias mitigation

Identify and correct spurious attention to background elements.

MiniCAM attention

Channel and spatial attention in MobileNetV2 toward colour, texture and moisture.

Hybrid ensemble

MobileNetV2+MiniCAM and Xception embeddings, SVM, XGBoost, TTA and grid-optimized weights.

Explainability analysis

Grad-CAM before and after: attention moves to freshness indicators.

Accurate and deployable

99.78% accuracy with 4.3 M parameters, 16.5 MB and 825.1 FPS: suitable for edge inspection in resource-constrained supply chains.

2 · Materials and Methods · Table I, Figs. 1–3

Meat Freshness Image Dataset
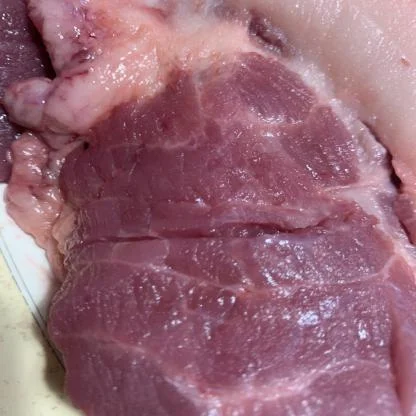
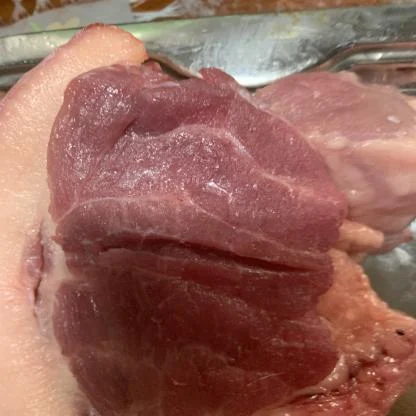
Fresh meat sample
Fresh: bright red, glossy, intact marbling
Semi-fresh meat sample
Semi-fresh: duller red, less sheen
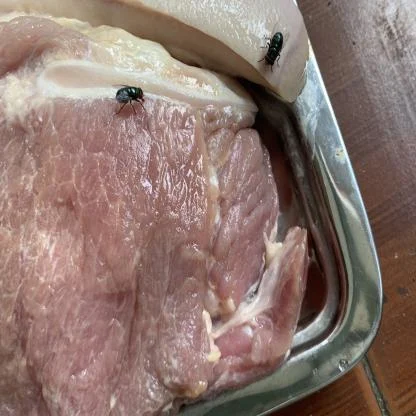
Spoiled meat sample
Spoiled: brown-grey, slime, flies
trainingtest
  • Public Kaggle dataset (V. Shanawad): 2,266 RGB beef images from real market settings.
  • Fixed split 1,815 / 451; 10% of training held out (stratified) for validation.
  • Provider preprocessing: EXIF orientation, resize to 416 × 416, no augmentation.

3 · Experiments · Tables III–IV, Figs. 5–6

Baseline: YOLO11s-cls Looks Excellent
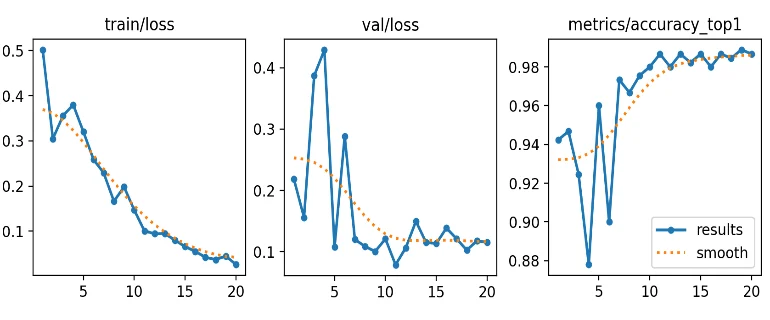
Training loss, validation loss and top-1 accuracy of YOLO11s-cls over 20 epochs
Loss and top-1 accuracy, 20 epochs
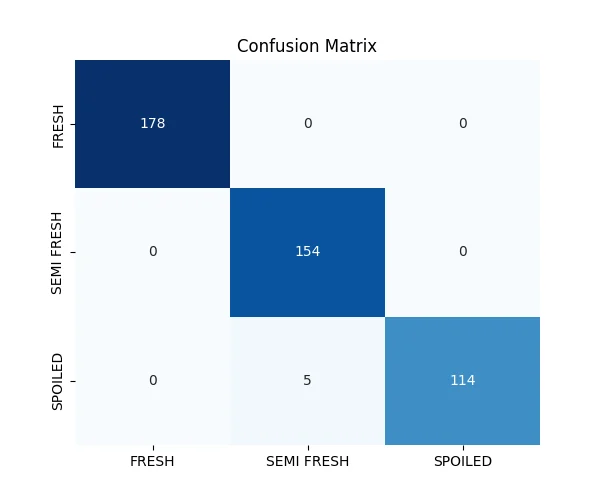
Confusion matrix of YOLO11s-cls on the test split
Test confusion matrix
ClassPrecisionRecallF1
Fresh1.00001.00001.0000
Semi-fresh1.00000.96860.9840
Spoiled0.95801.00000.9785
Weighted average0.98940.98890.9889

86 layers, C3k2 + SPPF, 5.4 M parameters, 12.1 GFLOPs, 224 × 224 input. Best epoch 19: top-1 98.89%, top-5 100%. The only 5 errors lie on the semi-fresh / spoiled boundary.

3 · Experiments · Fig. 7, Eq. (3)

…but It Is Looking at the Tray
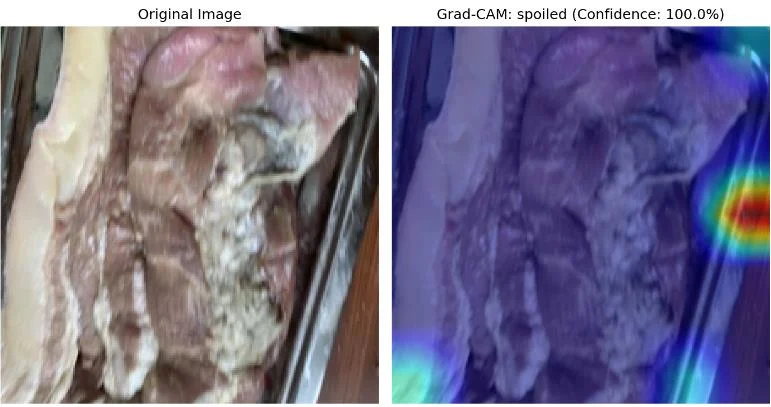
Grad-CAM of the baseline on a spoiled sample: the hottest region is the packaging tray at the right edge
LcGrad-CAM = ReLU( Σk αck Ak ),   αck = (1/Z) Σi Σj ∂yc / ∂Akij

A spoiled sample predicted with 100% confidence: the activation peaks on the packaging tray at the right edge, not on the discoloured, slimy meat. Gradients of the class score, averaged per feature map, weight the maps; ReLU keeps only positive influence.

4 · Proposed Method · Fig. 4

The Bias-Mitigated Ensemble
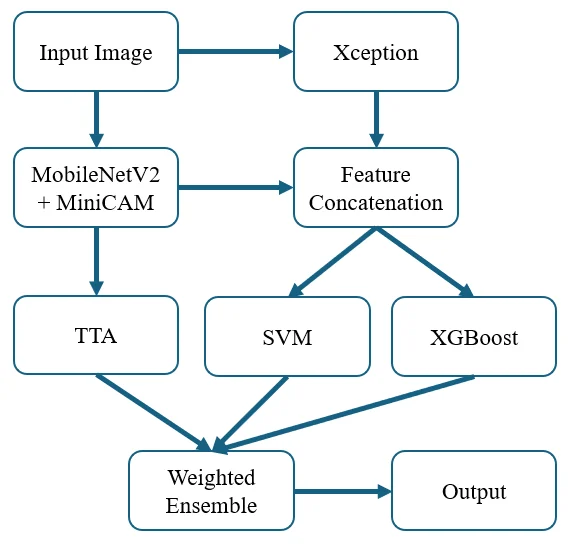
Framework: input image to MobileNetV2 with MiniCAM and to Xception; features concatenated for SVM and XGBoost; MobileNetV2 with TTA; weighted ensemble to output
  1. MobileNetV2 + MiniCAM, fine-tuned from ImageNet: the attention-guided backbone.
  2. Xception, frozen: complementary high-level embeddings (offline feature extraction).
  3. Both embeddings are concatenated and standardized (scaler fitted on training features only).
  4. SVM (linear) and XGBoost (depth 7, 300 trees) are trained on the fused features.
  5. MobileNetV2 predictions are averaged over 8 TTA views.
  6. A weighted average of the three probability vectors gives the class.

4 · Proposed Method · Eqs. (1)–(2)

MiniCAM: Telling the Network Where to Look

Channel attention: which features matter?

Mc = σ( W2 · ReLU( W1 · AvgPool(F) ) ) ∈ ℝC×1×1

Global average pooling summarizes each channel; a two-layer MLP reduces and restores the channel dimension and a sigmoid gives one weight per channel, boosting colour and texture responses.

Spatial attention: where is the evidence?

Ms = σ( Conv7×7( [AvgPool(F); MaxPool(F)] ) ) ∈ ℝ1×H×W

Average- and max-pooled maps across channels are stacked, convolved with a 7 × 7 kernel and squashed to a weight per location, so the meat surface can outweigh the tray.

Both maps multiply the backbone features: a small, cheap module that changes where MobileNetV2 collects evidence without changing its size class.

4 · Proposed Method · Table II

Test-Time Augmentation: 8 Views of One Sample

0°
90°
180°
270°
flip
flip + 90°
flip + 180°
flip + 270°

MobileNetV2 + MiniCAM classifies all 8 views (flip × 4 rotations) and averages the probabilities. Freshness does not depend on orientation, so the average is more stable than any single view.

4 · Proposed Method · Eq. (4)

Weighted Ensemble: Try the Weights

ŷ = argmaxc [ w1·PMobileNet-TTA(c) + w2·PSVM(c) + w3·PXGBoost(c) ]
w₁
w₂
w₃ = 1 − w₁ − w₂

Illustrative probabilities for one ambiguous semi-fresh / spoiled sample, not values from the paper. The paper grid-searched w₁ ∈ [0.4, 0.6] and w₂, w₃ ∈ [0.15, 0.3] on the validation set only and selected (0.5, 0.3, 0.2).

4 · Proposed Method · Table II

Training Setup

BackboneMobileNetV2 + MiniCAM
Feature extractorXception (frozen)
Input224 × 224
Optimizer / LRAdamW, 3e-4
Batch / early stop16 / 10 epochs
Losscross-entropy
Train augmentationflips, ±15° rotation, colour jitter
SVM / XGBoostlinear / depth 7, 300 trees

Hardware: Intel i5-12450H, 16 GB RAM, RTX 3050 Laptop (6 GB), Windows 11.

The best validation accuracy, 99.78%, was reached at epoch 22; early stopping ended training 10 epochs later.

Validation and test images were never augmented. Ensemble weights were chosen on validation data only; the test set was used once for the final report.

5 · Results · Figs. 8–9

Learning Curves and Confusion Matrix
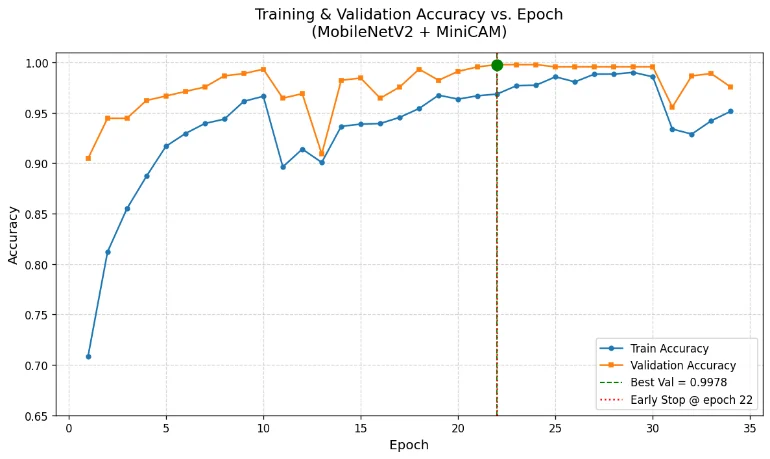
Training and validation accuracy of the proposed model over 34 epochs
Train / validation accuracy, best 0.9978 at epoch 22
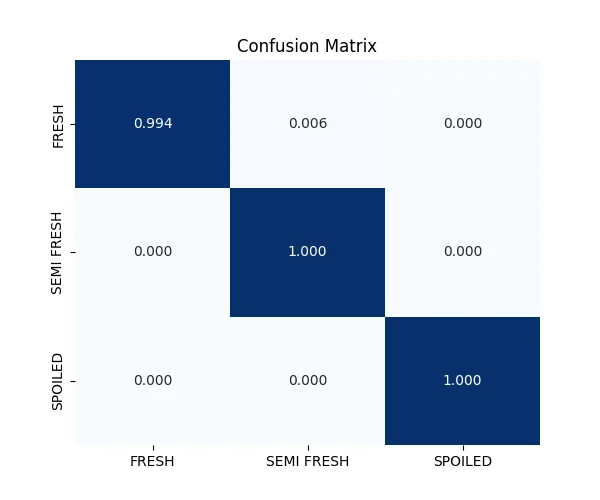
Normalized confusion matrix of the proposed model
Normalized, validation split
  • Train and validation curves stay close: no sign of overfitting.
  • Diagonal 0.994 / 1.000 / 1.000: a single fresh sample is called semi-fresh.
  • No confusion between semi-fresh and spoiled, the safety-critical boundary where the baseline erred.

5 · Results · Figs. 10–12

Grad-CAM after Bias Mitigation
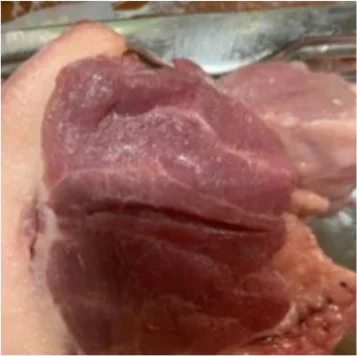
Sample
Heatmap

Slide the opacity to 0 to see the meat, then back up: red and yellow regions now sit on the meat surface, the cues a food scientist would use, instead of on the tray.

Correctly classified samples; heatmap and image are the two panels of each figure, stacked here.

5 · Results · Table V

Comparison with Other Methods

Metric

Values for other methods are taken from their papers, with different protocols and splits, so they are a reference rather than a head-to-head test. The axis starts at 0.65.

5 · Results · Table VI

Robustness and Efficiency

5-fold CV (reported)99.66 ± 0.23%stratified, image level
Parameters4.3 Mvs 5.4 M baseline
Model size16.5 MBedge-deployable
Throughput825.1 FPSRTX 3050 Laptop

Weights (w₁ / w₂ / w₃) chosen in each fold are shown on the right: the same in four of five folds. Fold 4 contains more ambiguous freshness stages and harder lighting.

6 · Discussion

Discussion and Limitations

Right for the right reason

Accuracy rises a little, but the main gain is that decisions now follow colour, texture and moisture, which matters when trays, lighting or shops change.

Safety-critical errors

The baseline's semi-fresh / spoiled confusions disappear in the proposed model's confusion matrix.

Qualitative bias evaluation

The dataset has no pixel-level tray masks, so bias reduction is shown with Grad-CAM, not measured with a metric.

One dataset

A single public beef dataset; comparisons with other studies use their reported numbers and protocols.

7 · Conclusion

Conclusion and Future Work

  • Grad-CAM revealed that a high-accuracy baseline relied on packaging trays.
  • MiniCAM + Xception fusion + SVM / XGBoost + TTA in a weighted ensemble reaches 99.78% accuracy and redirects attention to the meat.
  • 4.3 M parameters, 16.5 MB, 825.1 FPS: practical for non-destructive inspection at markets and retail points.

Next steps

  • Region-level annotations or weakly supervised segmentation for quantitative bias metrics
  • Multimodal inputs: hyperspectral imaging, odour sensors
  • Other food categories

7 · Conclusion

Check Questions

  1. The baseline reaches 98.89% top-1 accuracy. Why is it still considered unreliable?
  2. What do the channel and spatial parts of MiniCAM each decide?
  3. Why is test-time augmentation with rotations and flips appropriate for meat images?
  4. Why must the ensemble weights be chosen on the validation set, not on the test set?
  5. Why is the bias reduction evaluated qualitatively in this study?
Show answers
  1. Grad-CAM shows its decisions rest on packaging trays; such a shortcut can fail as soon as the tray or background changes.
  2. Channel attention weights which feature maps matter; spatial attention weights which image locations matter.
  3. Freshness cues do not depend on orientation, so averaging over 8 views reduces the variance of the prediction.
  4. Tuning on the test set would leak it into model selection and overstate the reported accuracy.
  5. The dataset has no pixel-level annotations of tray or background regions to compute a bias metric.

References

Selected References

  • V. Shanawad, Meat Freshness Image Dataset, Kaggle (2025).
  • R. R. Selvaraju et al., "Grad-CAM: Visual explanations from deep networks via gradient-based localization," ICCV, 2017.
  • M. Sandler et al., "MobileNetV2: Inverted residuals and linear bottlenecks," CVPR, 2018.
  • F. Chollet, "Xception: Deep learning with depthwise separable convolutions," CVPR, 2017.
  • P. Elangovan et al., "A novel approach for meat quality assessment using an ensemble of compact convolutional neural networks," Applied Sciences, 14(14), 5979, 2024.

See the full article for the complete reference list. Figures are reproduced from the article.

Thank You

Bias Mitigation in Ensemble-Based Meat Freshness Classification Using Grad-CAM
How to cite: Külcü, S., & Balpetek Külcü, D. (2026). Bias Mitigation in Ensemble-Based Meat Freshness Classification Using Grad-CAM. Balkan Journal of Electrical and Computer Engineering, 14, 74–82. doi:10.17694/bajece.1817907
sercan.kulcu@giresun.edu.tr · All publications
1 / 1